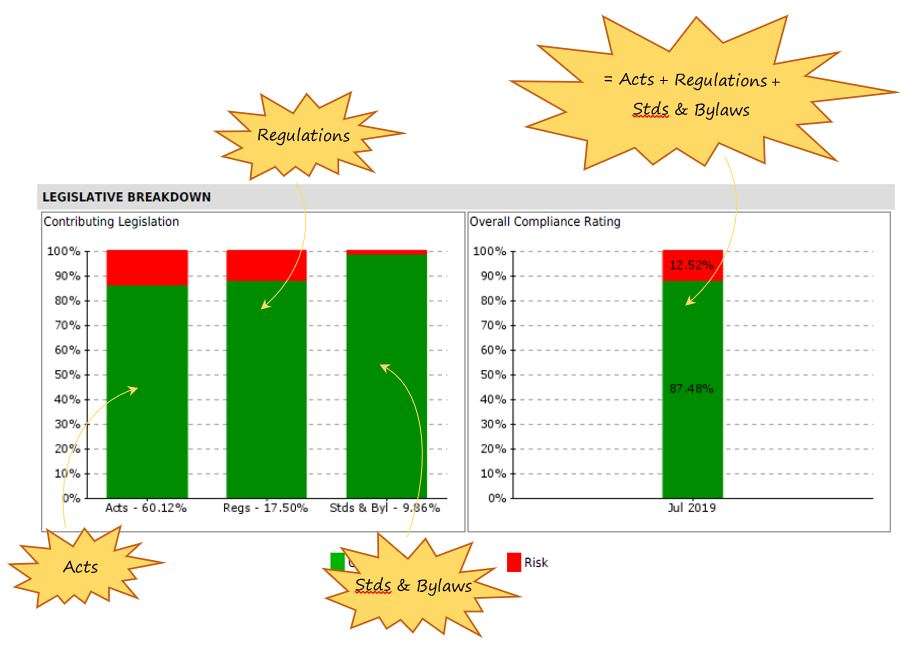
I’m confused, what do all these graphs mean in the SafetyWallet health and safety audit report?
Ahh, good question. But don't sweat it! It's all good! The graphs follow the formal introduction of the report. Whilst these might seem confusing at first, the clue to understanding them lies in the titles; the graph on the left says 'Contributing Legislation' and the graph on the right says 'Overall Compliance Rating':


Leave a comment