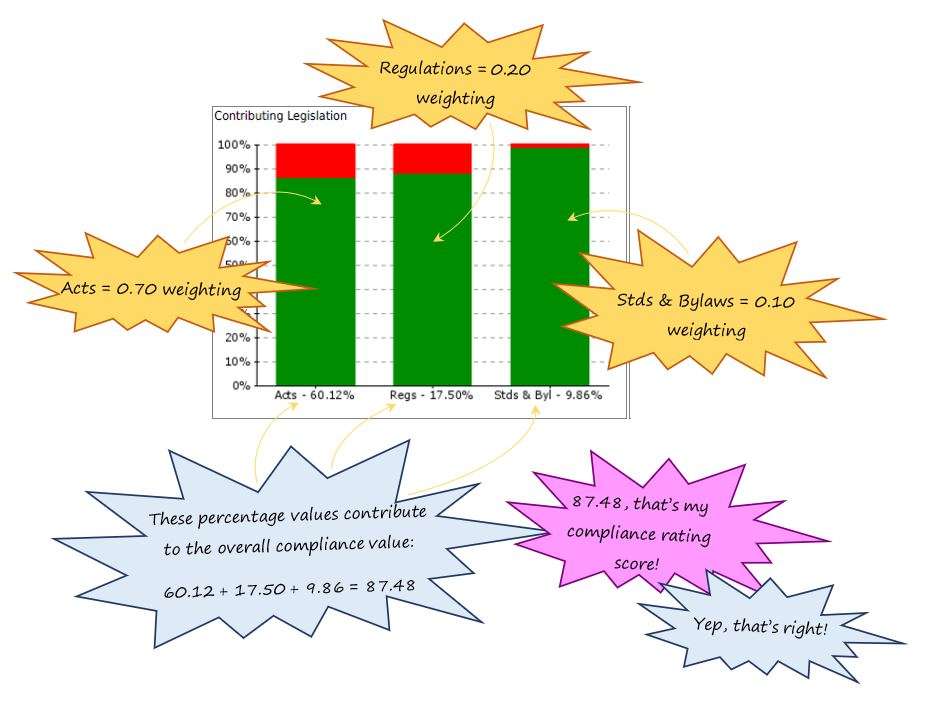
Okay, now I understand the right bar graph much better but the three bar graphs on the left, still don’t make sense in the SafetyWallet health and safety audit report?
Okay, no problems! Let's track backwards slightly. Remember earlier we spoke about how there are a number of different types of legislation. Each of the three bar graphs represent a different type of legislation affecting your health and safety:


Leave a comment